
Demystifying Resources and Reserves in Oil & Gas – By Aaditya Singh
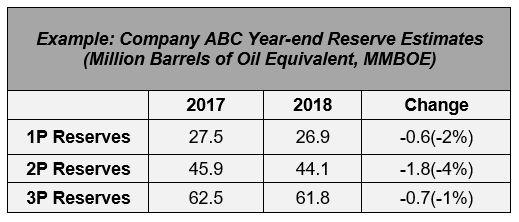
An Exploration & Production company announced its 2018 year-end reserves thus: “The company produced approximately 5.3 MMboe in 2018 that exceeded its planned production numbers and replaced 88% of its 2018 production on a 1P gross reserves basis.”
For the uninitiated, this piece of information may be difficult to understand. The objective of this article is to help develop a clear understanding of how the reserves are reported, how to make sense out of them, and how they form the lifeline of an Exploration & Production company.
Estimation of resources and reserves has multiple uses – capital expenditure calculation, cash-flow modeling, production modeling, company’s portfolio management, attracting investments, future planning, regulatory disclosures and a lot more. It’s not possible to make informed decisions on capital investments in oil & gas projects without first knowing how much oil could be recovered and made available for sale. The calculation of Net Present Value of such a project requires inputs like estimate of the ultimate amount of hydrocarbons which could be recovered and sold and the prices it may fetch. Basically, an accurate value of recoverable hydrocarbon volume gives an accurate valuation of the potential oil and gas reserves in the ground. Many oil and gas producing countries use their own systems of resource & reserve classification to keep track of development of their domestic oil and gas resources. However, in recent years, efforts are underway to harmonize the various systems that are followed worldwide to usher in uniformity and consistency.
To start with, two terms that are most often used in the industry are: Resources and Reserves. Albeit they seem to mean the same, they don’t. Oxford Dictionary defines the term ‘Resources’ as a stock or supply of money, materials, staff, and other assets that can be drawn on by a person or organization in order to function effectively, and the term ‘Reserve’ as a supply of a commodity (in this case, Hydrocarbons) not needed for immediate use but available if required.

To understand better the terms ‘Reserves’ and ‘Resources’, one can look at the McKelvery Box (1972) which deals with the Resources-Reserves relationship in a lucid manner. It shows that Resources are estimates of the total amount of hydrocarbons that are present in the ground. In addition to the discovered and commercial hydrocarbons, it includes the hydrocarbons that are discovered yet not considered economically feasible to produce, as well as the undiscovered resources. Reserves, on the other hand, are viewed as the ‘commercially exploitable oil that is in-situ’. In other words, it is the part of the resources that is economically viable to produce, which means “tangible money” to an Exploration & Production company. These reserves are further classified into three sub-categories – Proven (P1), Probable (P2) & Possible (P3) reserves depending on the degree of probability and the level of technical certainty of production.
Why the terms probability and certainty are used here? Historically, there have been two approaches towards the estimation of reserves: Deterministic & Probabilistic (also called Stochastic). In deterministic method, reserves are calculated as a single best estimate which is based on best estimates of input parameters (geological, engineering & economic). So, the estimate is more tangible and explainable. However, it is well known that the subsurface data have some degree of uncertainty. In probabilistic method, the known data are used to generate a range of estimates of the input parameters and their associated probable reserve estimates. In this method, one cannot work back the true input parameters used while calculating the reserves. Result is known only in a range of probability (probabilities decrease from 90% for proved reserves, 50% for probable and 10% for the possible category). Probabilistic method is more popular in the industry as it enlarges the scale and scope of canvas for the companies to work upon, and considers the fact that the input parameters for reserve estimation tend to vary with the maturity of the project and availability of more data.
The most widely used set of standards defining reserves and resources today is the SPE Petroleum Resource Management System (SPE-PRMS). According to SPE: (1) The term ‘Resources’ is intended to encompass all quantities of Hydrocarbons naturally occurring within the Earth’s crust, discovered and undiscovered, recoverable and unrecoverable, plus the hither-to produced quantities. Further, it includes all types of Hydrocarbons whether contemporarily considered conventional or unconventional. (2) The term ‘Reserves’ are those quantities of Hydrocarbons anticipated to be commercially recoverable through development projects to known accumulations from a given date forward under defined conditions. Reserves shall invariably satisfy four criteria: discovered, recoverable, commercial, and remaining based on the development project(s) concerned. (Source: SPE-PRMS)
Sub-categories of reserves:
Proven (P1) reserve is an estimate of recoverable volume with a probability of recovery greater than 90% under present technical & economic conditions. It considers the prices and costs at the time of estimation and not forecasted prices. It is calculated using detailed seismic analysis, well tests, core sampling, well logging and other studies to reach a relatively higher degree of certainty. Therefore, it is also referred to as Measured reserve.
Probable (P2) reserve is an estimate of recoverable volume with a probability of recovery equal to or above 50% and less than 90%. It is also known as Inferred reserve. Its estimation involves less rigorous assessment & analysis, which may include a few well tests or even just 3D seismic with no drilling.
Possible (P3) reserve is an estimate of recoverable volume with a chance equal to or above 10% and less than 50% of being economically and technically feasible to extract. A reserve is classified in this category when there is an indication of presence of oil from a geological point of view, but the market scenario is not conducive for further on the ground tests and analyses.
P1, P2 and P3 as described above are individual components of the Maximum Reserves estimate, i.e. P1 + P2 + P3. There is another set of terms that is most often used in the industry, viz., 1P (P90), 2P (P50) and 3P (P10) reserve estimates, as mentioned in the referred article in the beginning. These are cumulative terms and are defined as following:

1P (P90) = Proved reserves (P1)
2P (P50) = Proved + Probable reserves (P1 + P2)
3P (P10) = Proved + Probable + Possible reserves (P1 + P2 + P3)
1P is also referred to as P90 or a High Probability estimate, 2P as P50 or a Median Probability estimate and 3P as P10 or a Low/Optimistic Probability estimate.
Now, consider the news report referred to in the beginning. From the table of estimated reserves, it can be seen that the company ABC’s reserves have decreased from that of in 2017 to 2018 in all the three categories of recoverable reserves – 1P, 2P & 3P. The company cited excess production (more than planned) in the year 2018 as the major reason for this decline. A decrease in 1P reserves isn’t a good news for the company as it indicates that the company’s cash cow has taken a hit and it must pump in more capital in coming years in exploration & appraisal activities or look for new acquisition opportunities to enable a jump in its proven reserves estimate figures. A decrease in 2P & 3P reserves may not be a negative indicator if it is supplemented by a simultaneous increase in 1P reserves as this indicates that the company has been able to convert its poorer category reserves (P2 & P3) into proven reserves (P1). Another highlight of the report is that although the company had produced approximately 5.3 MMboe in 2018 from its 1P reserves estimate, it was able to replace 88% of the production, i.e. 4.7 MMboe (88% of 5.3 MMboe) in its 1P reserves balance. It may be noted that this is a positive outcome from the company’s performance report in 2018 as it is indicative of the fact that the company is working in the right direction on its 1P category reserves.
It is necessary to note here that the prices of oil and gas are a major driver for reporting of reserves. An increase in oil and gas prices has a direct impact on the profits earned by the company and its future expenditure budget. It can facilitate meeting the breakeven price of advance extraction technologies, well appraisals, well tests and construction of expensive production facilities.
Reserves that were earlier categorized as sub-commercial become economically recoverable as oil and gas prices rise. This leads to reclassification of reserves from a probable or possible category to a proved category. The opposite is also true. In such cases, proven reserves are re-estimated and reduced.
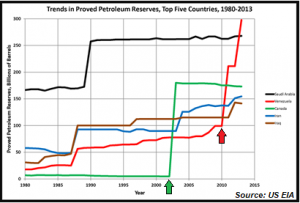
The first decade of this century witnessed two countries viz. Canada & Venezuela take quantum jumps in their estimates of proven reserves. The favorable oil price supported extensive research & development of technology for commercial extraction of heavy oil (Venezuela) and oil sands (Canada). This led to billions of barrels of hydrocarbons “resources” being added to the “proved reserves” category. This can be observed from the red line (Venezuelan reserves) & green line (Canadian reserves) in the chart below.
Finally, it is very important to understand how these numbers are arrived at. For that, it is necessary to look at the classification system of the hydrocarbon resources and a few terms used in reserves estimation like the Original Oil/Gas In Place (OOIP/OGIP) and Estimated Ultimate Recovery (EUR). This can be understood from the Hierarchy Tree & Venn Diagram below.
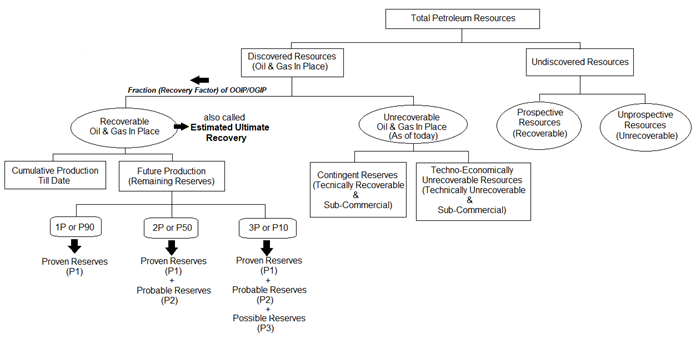
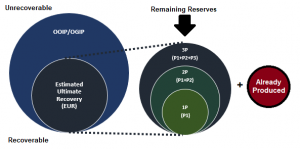
OOIP/OGIP (Original Oil in Place/Original Gas In Place) – Total volume of hydrocarbon stored in a reservoir prior to production.
EUR (Estimated Ultimate Recovery) – Estimate of total oil which can be removed. It is a fraction (Recovery factor) of OOIP/OGIP.
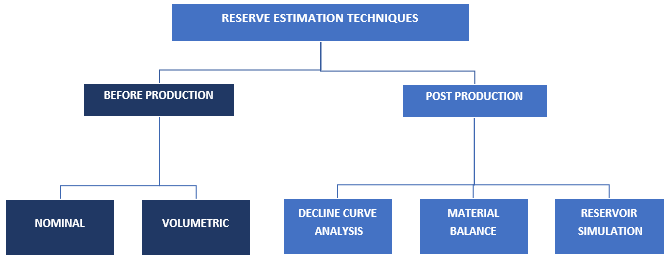
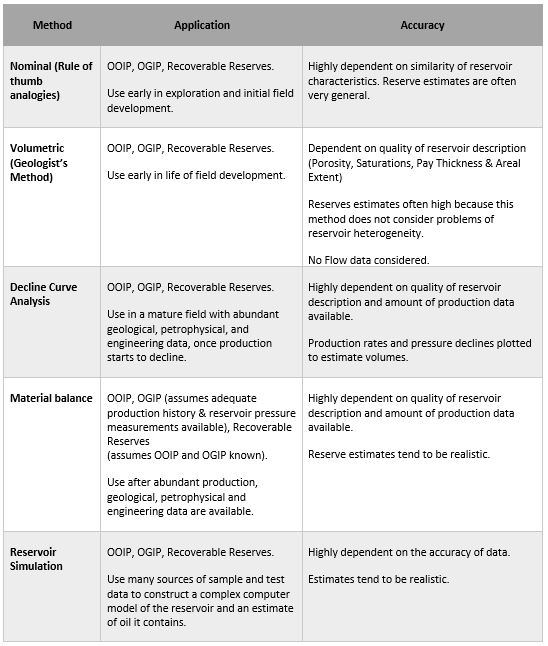
Reserves Estimation Techniques:
Estimating hydrocarbon reserves is a complex process that involves integrating geological and engineering data. The method(s) used depends on the maturity of the development project and the amount and quality of data available. Conventionally, there are five commonly used Reserve Estimation techniques which have been summarized below:
By Aaditya Singh
 Author – Aaditya Singh is a Reservoir Engineer at Hindustan Oil Exploration Company Limited. His primary role in the company entails management and updating of the Hydrocarbon production database, and analysis of the subsurface data for improvement in Hydrocarbon recovery. He is involved in activities related to the development and production of oil and gas reservoirs, including planning and management of Hydrocarbon exploitation process. His interests include reading, writing, music, hiking and swimming.
#Title Image courtesy of yodiyim at FreeDigitalPhotos.net
References:
Downey, M. P. (2009). Oil 101
https://www.lexico.com/en/definition/resource
https://www.lexico.com/en/definition/reserve
http://subsurfwiki.org/wiki/File:Simple_McKelvey_box.svg
https://www.spe.org/en/industry/petroleum-resources-management-system-2018/
https://www.linkedin.com/pulse/comparison-deterministic-probabilistic-methods-improve-jordi-vilanova
https://en.wikipedia.org/wiki/File:Oil_Reserves_Top_5_Countries.png